
View Users - Analyzing Charts
👤This documentation is intended for View Users.
Users can transform their charts to analyze by filtering, sorting, zooming, and also pivoting their results. Charts can also have descriptions attached to it and tooltips to show more details on the graph.
For information on exploring Topics and Dashboards, click here.
For information on downloading and sharing data, click here.
<div>
<UL>
<LI><a href="#Filters">Using Dashboard Filters</a></LI>
<LI><a href="#Description">View the chart description</a></LI>
<LI><a href="#Refresh">Refresh charts</a></LI>
<LI><a href="#Tooltips">Viewing tooltips</a></LI>
<LI><a href="#Sorting">Sorting tables</a></LI>
<LI><a href="#Pivot">Pivoting tables</a></LI>
<LI><a href="#Searching">Searching in tables</a></LI>
<LI><a href="#Legend">Using a chart's legend</a></LI>
<LI><a href="#Zooming">Zooming in on graphs</a></LI>
</UL>
</div>
<HR>
Using Dashboard Filters
<a name="Filters"></a>
With Dashboard Filters, data on multiple charts within a dashboards can be narrowed down to only show relevant information based on the filter values chosen. If dashboard filters are enabled, it will be displayed as a bar above the charts that can be expanded by clicking to show all filters.
If the values are square checkboxes, multiple values can be chosen for that filter. If they are round radio buttons, only one value can be chosen for that filter. To apply the filter combinations chosen, click the green "Apply" button on the bottom right of the filter bar.
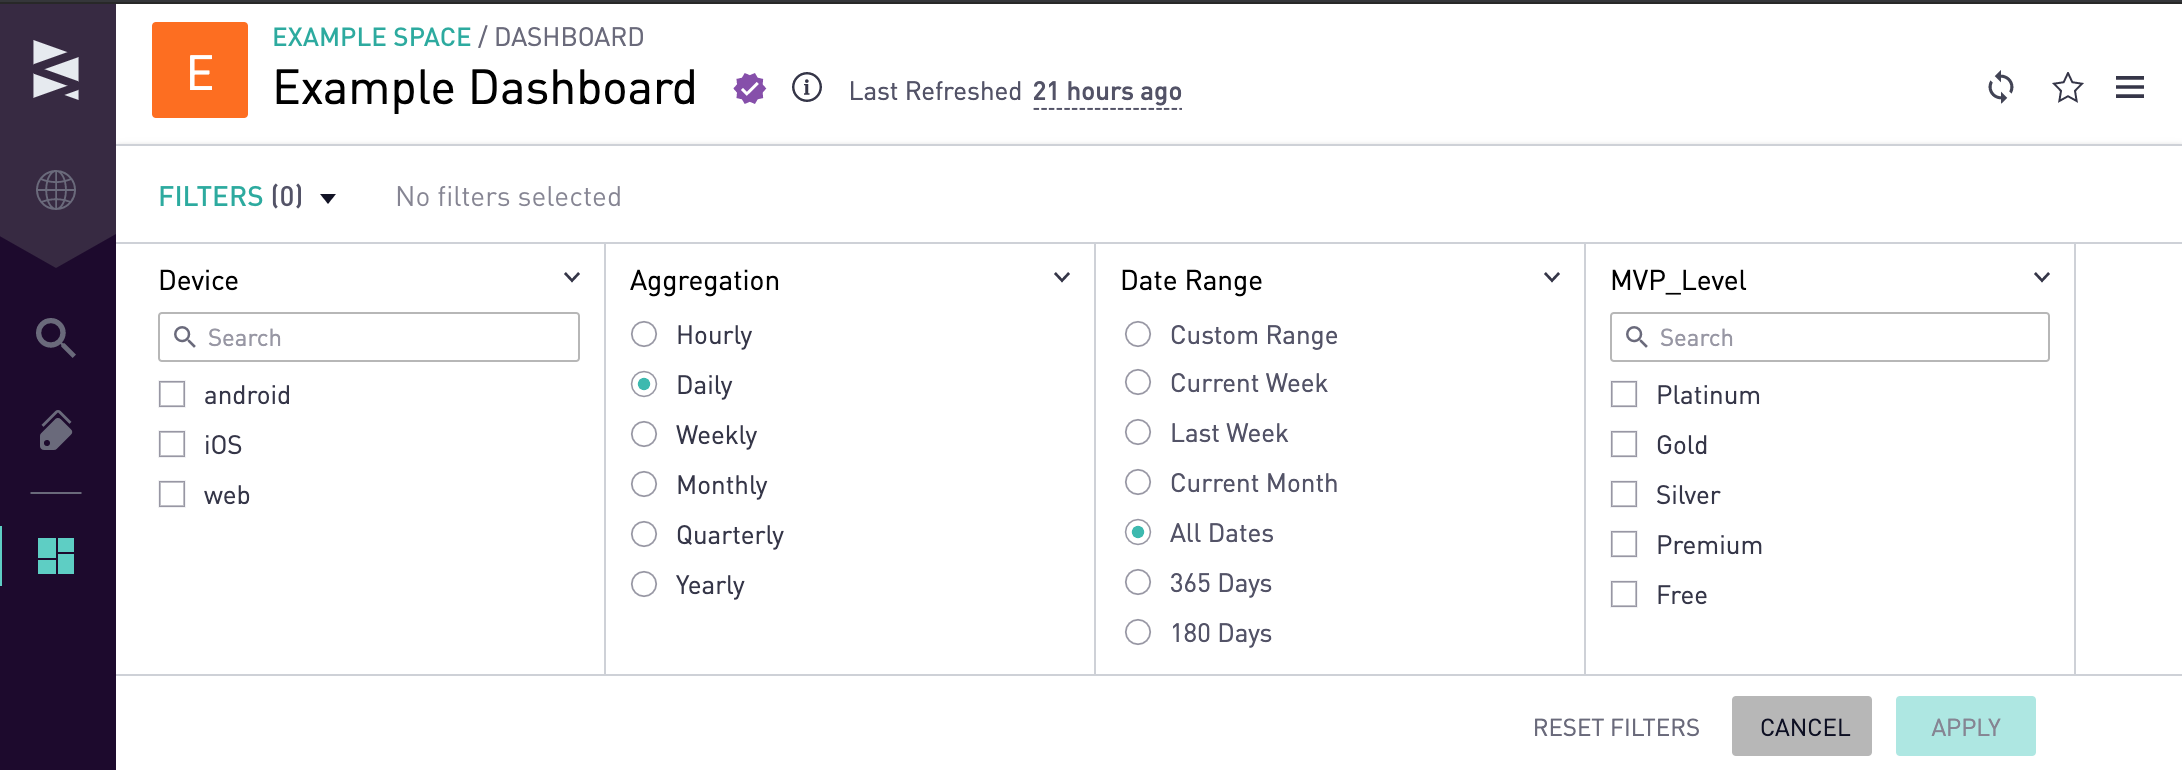
The last combination of filter values that the user chose will be saved for when that user returns to that dashboard. The Reset Filters button next to the Cancel and Apply buttons will reset the values to its default combination. The default filter values are determined by the dashboard owner.
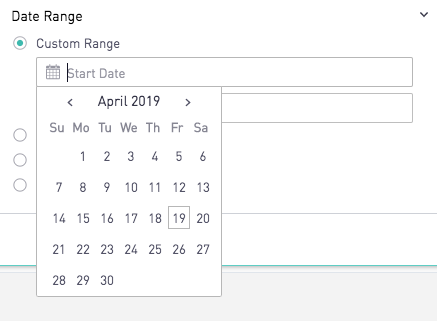
Date Range Filter
If there is a Date Range filter on the dashboard, users have the option to choose a Custom Range. When choosing a custom range, the user can click the calendar icon to pick a day off of a calendar or type in their custom date.
Aggregation Filter
<a name="Description"></a>
If there is an Aggregation filter on the dashboard, users can group the data by the selected format. Click on one aggregation option to view the chart's data aggregated to that time group.

<a href="#top">Back to top</a>
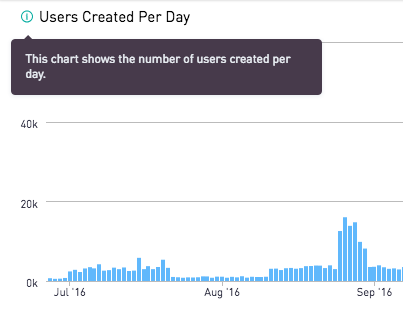
View the chart description
Charts with an info icon come with a description added by the creator of the chart. Hovering over the icon will show the full description.
<a name="Refresh"></a>
<a href="#top">Back to top</a>
<a name="Tooltips"></a>
Refresh Charts
In order to have the most up to date data, charts need to be refreshed whenever the underlying data is updated. Charts and dashboards have an automatic refresh rate but users can manually trigger chart refreshes by clicking on the refresh icon.

<a name="Sorting"></a>
<a name="Pivot"></a>
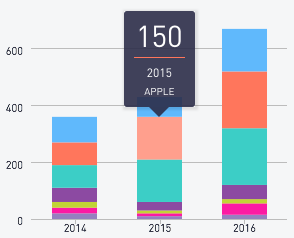
Viewing Tooltips
By hovering over points on a graph, users can see more details on that specific point.
Sorting Tables
To easily sort tables by a certain column, users can click on the column header to sort that column in ascending order. Users can click again to sort in descending order and refresh the chart to reset to the default ordering.
<a name="Searching"></a>
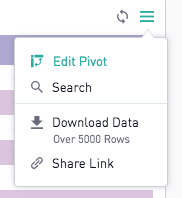
Pivoting Tables
Users can edit the pivot of some tables by clicking on the hamburger menu on the top right corner of the chart and then clicking “Edit Pivot”. After clicking on “Edit Pivot” the pivot settings will pop up over the chart. Users can then drag and drop the fields in the correct quadrant to pivot their table as needed. This option may not be available on all tables since chart creators can disable this feature.
<a href="#top">Back to top</a>
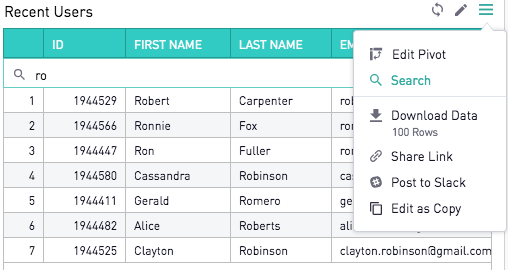
Searching in Tables
<a name="Legend"></a>
Users can search for values in Tables and Cohort Grids by clicking on the Search option in the chart menu.
Using a Chart’s Legend
<a name="Zooming"></a>
To filter chart results based on the series in a chart’s legend, click a series to include or exclude it. Users can also double click it to see only that series and uncheck all others. This can be most useful when there are many series to choose from.
Zooming in on Graphs
<a name="ShareChart"></a>
To zoom in on a graph, click on the graph and choose the beginning of the range to zoom in on, dragging and releasing the cursor at the end of the range.
<a href="#top">Back to top</a>
<a name="PDF"></a>
<a name="ChartLink"></a>