
Getting Started - Data Discovery
👤 This documentation is intended for Discovery Users.
Data Discovery Users have the ability to create analytics using Sisense for Cloud Data Teams' drag and drop interface without any coding. The datasets that Discovery users can work with can be CSVs or customized datasets created by a SQL User.
<div>
<UL>
<LI><a href="#BuildChart">Build a Chart</a></LI>
<LI><a href="#UploadCSV">Upload a CSV</a></LI>
<LI><a href="#Datasets">Datasets</a></LI>
<LI><a href="#CalculatedFields">Create Calculated Fields</a></LI>
<LI><a href="#Share">Share and Download</a></LI>
</UL>
</div>
Note: Data Discovery is available on select plans. Site administrators can contact their Account Manager for additional information
<HR>
<a name="BuildChart"></a>
Build a Chart
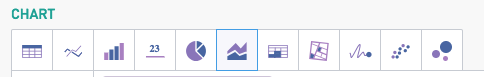
Data Discovery Users can create Drag and Drop charts by clicking the New Exploration button on the left-hand menu bar or by clicking New Chart in the right hand corner of a dashboard!

Discovery Users can choose to build a table, line graph, bar graph, a number overlay chart, pie chart, cohort grid, map chart, sparkline chart, scatter plot, or a bubble chart.
<a name="UploadCSV"></a>
<a href="#top">Back to top</a>
Upload a CSV
Users can upload CSVs to use as a source for charts. Users can drag and drop a file to the bottom of the menu bar or click Upload while in the Discovery chart editor.

<a href="#top">Back to top</a>
<a name="Datasets"></a>
Datasets
Datasets are Sisense Views that are specifically curated for Discovery users to explore using the Drag and Drop interface. Datasets must be created by a SQL user querying a table from a database or by uploading a CSV. The fields from the dataset will be presented in the left hand side of the chart editor and available to drag and drop into the appropriate fields of the chart.
Datasets can be chosen in the Dataset dropdown menu in the chart editor. Datasets can be organized and found by their Tags or Topics.
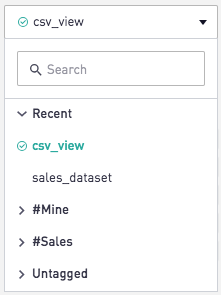
A green check next to the name of the Dataset means that the dataset is stored in the Sisense Cache. A red x next to the name of a CSV means that the CSV failed to upload and cannot be used as a Dataset.

<a name="CalculatedFields"></a>
<a href="#top">Back to top</a>
Creating Calculated Fields
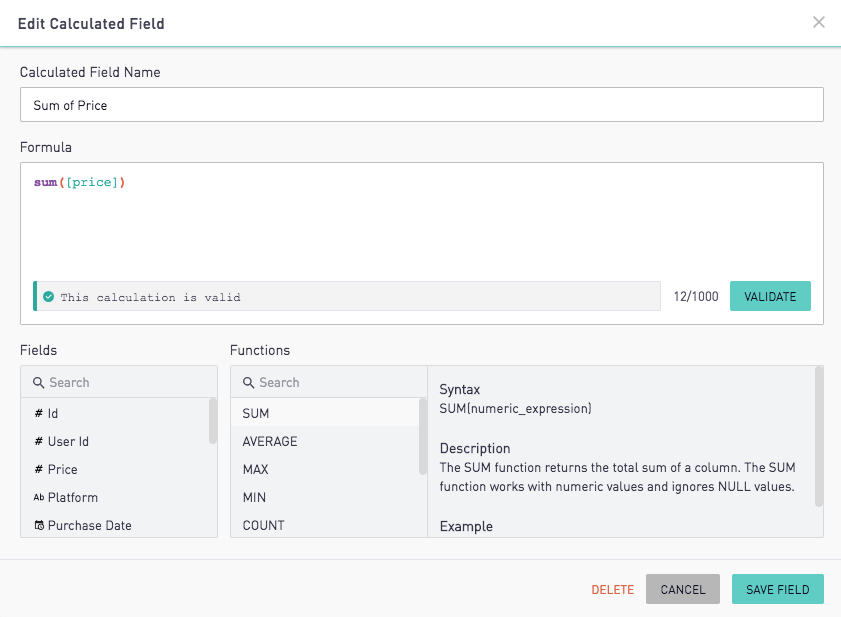
Calculated fields are how basic calculations and aggregations are done on Discovery fields. In order to create a Calculated field, a user will click the + icon above their Dataset fields.
Then the user will assign a name, add a formula, validate the formula then click Save Field. A Calculated Field can then be dragged into the chart editor like any other field.
<a name="Share"></a>
Download and Share
Sisense for Cloud Data Teams allows users to download their data in multiple formats in order to share with others inside and outside of their organization. Downloading charts can be useful when creating presentations with data visualizations, quickly sharing an insight with a colleague over Slack, emailing insights as CSV attachments and more.
- Share Externally with Dashboard Links and Embeds
- Easily Embed Dashboards
- Download Dashboard PDFs
- Schedule Email Reports
- Download a CSV of a chart
- Share to Slack
Note: All of these features are available on select plans or may be disabled by a Site Administrator. Users should contact their Site Administrator for more information.
<a href="#top">Back to top</a>