
Chart Options
👤 This documentation is intended for SQL Users.
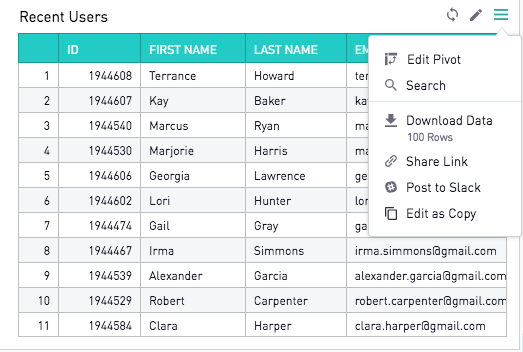
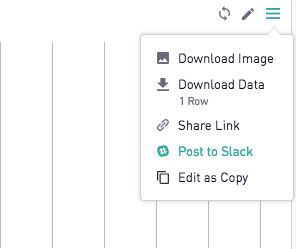
Several options can be accessed from the dashboard level by clicking on the burger menu in the upper right-hand corner of the chart.
<div><UL>
<LI><a href="#EditPivot">Edit Pivot</a></LI>
<LI><a href="#SearchTable">Search</a></LI>
<LI><a href="#DownloadImage">Download Image</a></LI>
<LI><a href="#DownloadCSV">Download Data</a></LI>
<LI><a href="#ShareLink">Share Link</a></LI>
<LI><a href="#PosttoSlack">Post to Slack</a></LI>
<LI><a href="#EditCopy">Edit as Copy</a></LI>
<LI><a href="#ZoomChart">Zooming In On A Chart</a></LI>
</UL></div>
<a name="EditPivot"></a>
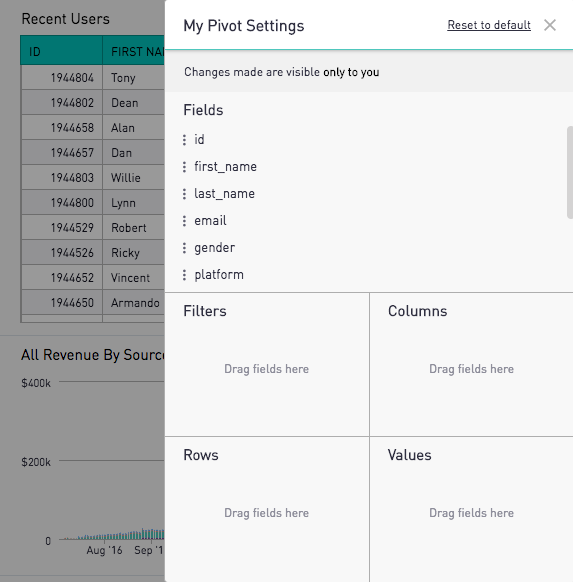
Edit Pivot
Available only for charts in the table format, "Edit Pivot" allows all users to access a table's pivot functionality. Like with filters, changes made to the pivot through this option will only be viewable by the user.
For more information, check out the documentation on how to set up and create settings for pivot tables.
<a href="#top">Back to top</a>
<a name="SearchTable"></a>
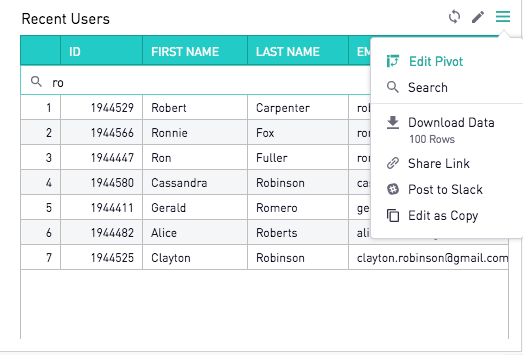
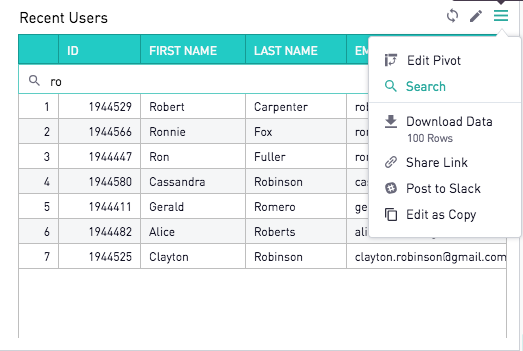
Search
Users can search for values in Tables and Cohort Grids by clicking on the magnifying glass icon and typing in values into the search bar that appears at the top of the chart.
<a href="#top">Back to top</a>
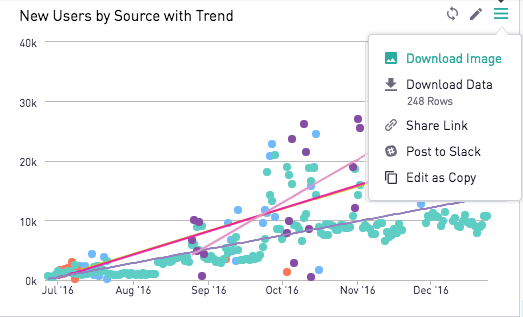
<a name="DownloadImage"></a>
Download Image
Graph-like charts can be downloaded as a PNG file through the "Download Image" option.
<a href="#top">Back to top</a>
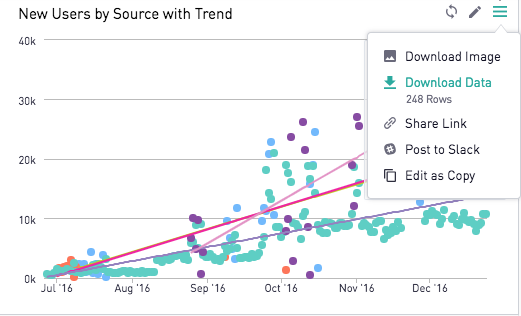
<a name="DownloadCSV"></a>
Download Data
The underlying dataset of any chart can be downloaded as a CSV file by selecting "Download CSV."

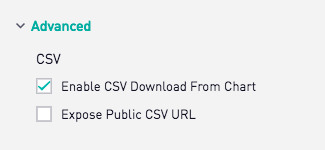
If a user has the appropriate permission level, the "Download CSV" option can be enabled/disabled in the chart format tab of the chart editor under "Advanced". Details on managing permissions for this option can be found under site preferences.
<a href="#top">Back to top</a>
<a name="ShareLink"></a>
Share Link
Graphs and tables can be easily shared with other users by creating a shared link. Clicking on "Share Link" will open up a new tab displaying the single chart without its underlying dashboard. Unlike externally-shared dashboards, only users with Sisense logins can access this view.
<a href="#top">Back to top</a>
<a name="PosttoSlack"></a>
Post to Slack
Sharing Sisense charts directly to Slack is a powerful way to communicate data. With "Post to Slack", users can easily post a chart to a Slack channel without leaving Sisense.
In the dropdown menu at the top right of a chart, clicking “Post to Slack” will open a pop-up window where the user can specify the Slack channel to post to, as well as include an optional short message.

In order to utilize the "Post to Slack" option, Slack Integration must be set up for the site. Documentation on how to setup Slack Integration can be found here.
Charts can be posted to public or private channels, however, the Sisense Slackbot must be a member of a channel in order for the integration to work. The Sisense for Cloud Data Teams bot can be invited by running /invite @Sisense in the public or private channel. More information on adding an app to Slack Channels can be found in the Slack docs here.
<a href="#top">Back to top</a>
<a name="EditCopy"></a>
Edit as Copy
To edit a chart as a copy, users can select "Edit as Copy" from the burger dropdown. The chart title will automatically display as "Copy of [Original Title]." Unless the chart is explicitly moved to another dashboard through the "Move to" option in the "Save" dropdown, the copy will be saved to the bottom of the original chart's dashboard.
<a href="#top">Back to top</a>
<a name="ZoomChart"></a>
Zooming In On A Chart
To zoom on a chart, click on the graph and choose the beginning of the range to zoom in on, dragging and releasing the cursor at the end of the range.
<a href="#top">Back to top</a>