
Getting Started - Analysts
👤 This documentation is intended for SQL Users.
With Sisense for Cloud Data Teams, Analysts have access to a large set of tools to analyze their data in more custom ways. Organizing, examining, and sharing data can easily be done through Sisense for Cloud Data Teams.
<a name="Video"></a>
<div>
<UL>
<LI><a href="#Video">Watch the Analysts Video Tutorial</a></LI>
<LI><a href="#Topics">Creating Topics</a></LI>
<LI><a href="#Dashboards">Creating Dashboards</a></LI>
<LI><a href="#Sqlcharts">Creating Charts with SQL</a></LI>
<LI><a href="#Codecharts">Creating Charts with Python and R</a></LI>
<LI><a href="#DDcharts">Creating Charts with Data Discovery</a></LI>
<LI><a href="#Snippets">SQL Snippets</a></LI>
<LI><a href="#Views">Utilizing Views</a></LI>
<LI><a href="#VersionControl">Version Control</a></LI>
</UL></div>
<a name="Topics"></a>
<HR>
Watch the Analyst Video Tutorial
<html>
<body>
<iframe width="560" height="315" src="https://www.youtube.com/embed/F4FwRcKb95w" frameborder="0" allow="accelerometer; autoplay; encrypted-media; gyroscope; picture-in-picture" allowfullscreen></iframe>
</body>
</html>
<a name="Dashboards"></a>
Creating Topics
Topics are the highest level of organization in Sisense for Cloud Data Teams. Topics can be configured for different teams, projects, and use cases. They hold all related dashboards, other topics, snippets, alerts, and views that so that they can be easy to find. Topics can be marked as Official so that all users are aware which topics are important.
Creating Dashboards
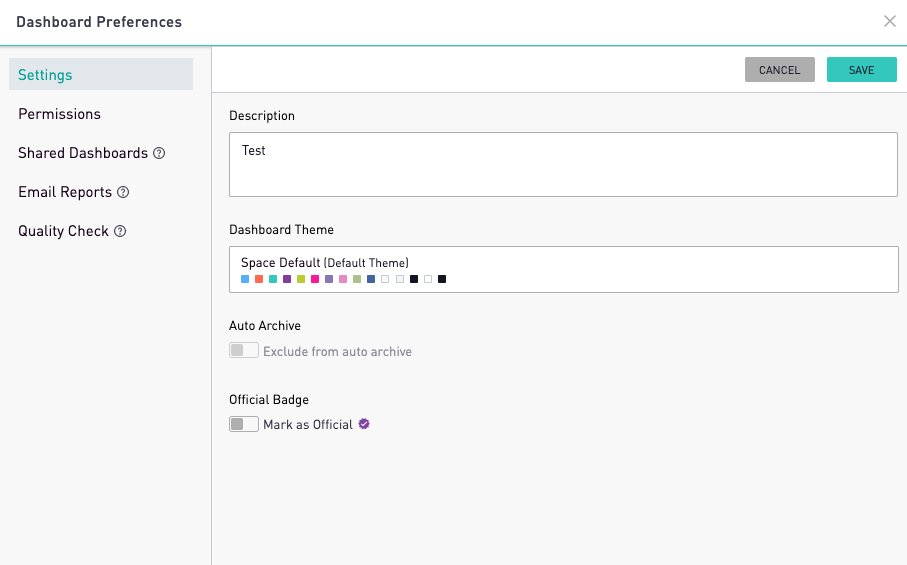
Dashboards are the main platform for reporting and displaying related charts. Dashboards can also have filters and text boxes to further detail the report. Access to each dashboard can be specified by Admin users and dashboards can also be scheduled to send reports daily through email or Slack.
- Dashboard Overview
- Organizing Charts
- Text On Dashboards
- Dashboard Permissions
- Scheduled Reports
- Shared Dashboards
<a name="Sqlcharts"></a>
<a href="#top">Back to top</a>
Creating Charts With SQL
Sisense provides a set of prebuilt chart types that make it extremely easy to visualize data in multiple different ways. With just SQL, users are able to transform their queried table into the following types of charts:
<div>
<UL>
<LI>Tables:</LI>
<UL>
<LI><a href="https://doc.periscopedata.com/article/tables#article-title">Tables</a></LI>
<LI><a href="https://doc.periscopedata.com/article/cohort-grids">Cohort Grids</a></LI>
<LI><a href="https://doc.periscopedata.com/article/pivot-tables">Pivot Tables</a></LI>
</UL>
<LI>Graphs:</LI>
<UL>
<LI><a href="https://doc.periscopedata.com/article/map-clusters-and-bubbles">Cluster and Bubble Charts</a></LI>
<LI><a href="https://doc.periscopedata.com/article/pie">Pie Charts</a></LI>
<LI><a href="https://doc.periscopedata.com/article/image-charts">Image Charts</a></LI>
<LI><a href="https://doc.periscopedata.com/article/mixing-chart-types">Mixing Chart Types</a></LI>
</UL>
<LI><a href="https://doc.periscopedata.com/article/making-map-charts">Map Charts:</a></LI>
<UL>
<LI><a href="https://doc.periscopedata.com/article/tables#article-title">HeatMaps</a></LI>
<LI><a href="https://doc.periscopedata.com/article/satellite-maps">Satellite Maps</a></LI>
<LI><a href="https://doc.periscopedata.com/article/geojson">Plotting GeoJson</a></LI>
</UL>
</UL>
</div>
Here's more information on chart options
<a name="Codecharts"></a>
SQL Formatters
In order to fully take advantage of Sisense's SQL editor, users will need to get familiar with helpful syntax and shortcuts. These shortcuts include formatting timezones, converting to dollars or percentages, and truncating dates. Using these formatters make writing queries more efficient and readable.
- Using SQL Formatters
- Automatic Joins
- Date Parts
- Composing SQL Formatters
- Dollars and Percentage Shortcuts
- Timezone Formatters
<a href="#top">Back to top</a>
Creating Charts With Python and R
<a name="DDcharts"></a>
Sisense for Cloud Data Teams' Python and R integration allow analysts to go beyond the limits of prebuilt charts. With a long list of libraries that include matplotlib, pandas, wordcloud, and plot.ly, users can customize and even create interactive charts on their dashboards.
Note: The Python and R Integration is available on select plans. Site Administrators can contact their Account Manager for additional information.
Creating Charts With Data Discovery
<a name="Snippets"></a>
Users can also build charts using the Discovery Interface. Discovery Users can build charts by dragging and dropping fields to create visualizations with no SQL or code necessary.
Note: Data Discovery is available on select plans. Site Administrators can contact their Account Manager for additional information.
<a href="#top">Back to top</a>
<a name="Views"></a>
SQL Snippets
SQL Snippets are saved sections of code that a user can save to be reused across the site. Snippets are great for creating shortcuts to tedious SQL that would usually have to be fully written out in every chart. If a user anticipates that a section of SQL will be reused in multiple different charts, Snippets are a great solution.
Utilizing Views
Views allow users to define a set of data that can be saved and reused across the site. They are referred to like any table in a query but with the bracket notation.
<body>
<blockquote>
select * from [my_view]
</blockquote>
</body>
<LI><a href="https://doc.periscopedata.com/article/views">Views</a></LI>
Materializing Views
<a name="VersionControl"></a>
With the Cache add-on, views can be stored on the Sisense Cache as a table. When a materialized view is referenced in a query, it is pulling a saved result rather than rerunning the view as a subquery instead. Utilizing materialized views and the Sisense Cache is a great way to optimize queries and speed up runtime. In order to materialize a view, all of the tables that the view’s query is referencing must also be cached.
<a href="#top">Back to top</a>
Version Control
Users can see the history of a chart, snippet, alert, or view by clicking the clock icon on the right hand menu bar within the chart editor. Users can see who made what kind of change and even revert it back to a previous state.
Git Integration
Sisense for Cloud Data Teams' Git Integration allows users to connect their Sisense Space to a Git Repository in order to have a more enhanced version control experience.
Note: The Git Integration is available on select plans. Site Administrators can contact their Account Manager for additional information.
<a href="#top">Back to top</a>