
Pivot Tables
Pivot tables allow users to interact and transform datasets without changing a chart's SQL. Through dragging and dropping the columns and rows from a result set, pivot tables can display, filter, and aggregate data all at the dashboard level. Pivot tables are automatically included in shared and embedded dashboards, allowing external partners to further analyze result sets.
In this article:
<div><UL>
<LI><a href="#CreatingPivot">Creating a Pivot</a></LI>
<UL>
<LI><a href="#ColumnsandRows">Columns and Rows</a></LI>
<LI><a href="#Values">Values</a></LI>
<LI><a href="#Filters">Filters for Pivots</a></LI>
</UL>
<LI><a href="#Modification">Modification and Formatting</a></LI>
<UL>
<LI><a href="#Fields">Available Fields for Pivoting</a></LI>
<LI><a href="#FormattingMod">Formatting Modification</a></LI>
</UL>
<LI><a href="#Settings">Settings and Permissions</a></LI>
<UL>
<LI><a href="#Permissions">Pivot Creation and Editing Permissions</a></LI>
<LI><a href="#Default">Default Pivot Table Settings for Dashboard</a></LI>
<LI><a href="#ResettingDefault">Resetting to Default Settings</a></LI>
</UL>
<LI><a href="#Share">Sharing a Pivot Table</a></LI>
<LI><a href="#NotesandTips">Notes and Tips</a></LI>
<UL>
<LI><a href="#TurnOff">Turning off Pivotability</a></LI>
<LI><a href="#Drilldowns">Pivot Table and Drilldowns</a></LI>
<LI><a href="#Shared">Pivot Tables in Shared & Embedded Dashboards</a></LI>
<LI><a href="#Timeout">Pivot Timeout</a></LI>
</UL>
</UL></div>
<HR>
<a name="CreatingPivot"></a>
Creating a Pivot
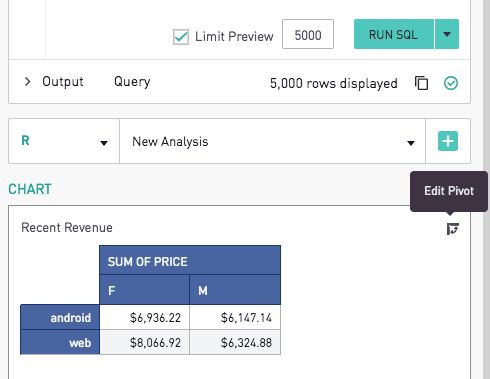
Pivot tables are an extension of all table-like charts. Click the "Edit Pivot" option after choosing the hamburger icon in the upper right-hand corner of the chart.
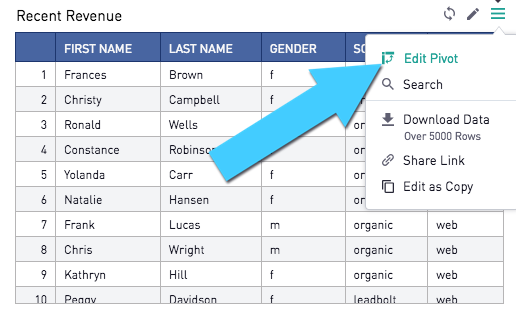
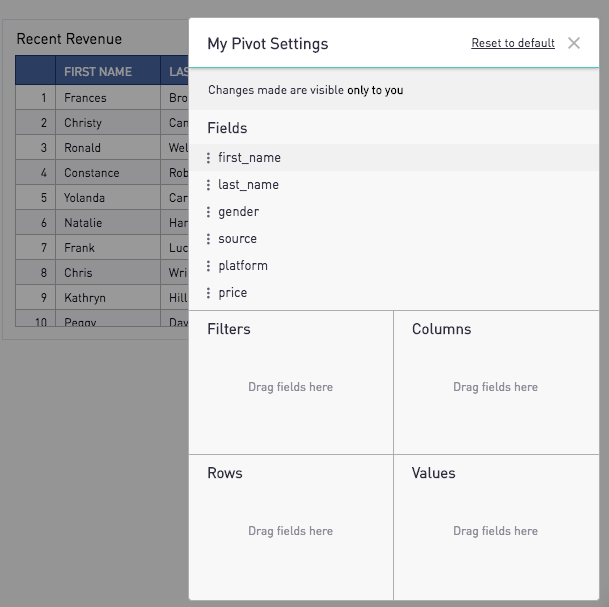
This will bring up the Pivot Settings menu of options.
<a href="#top">Back to top</a>
<a name="ColumnsandRows"></a>
Columns and Rows
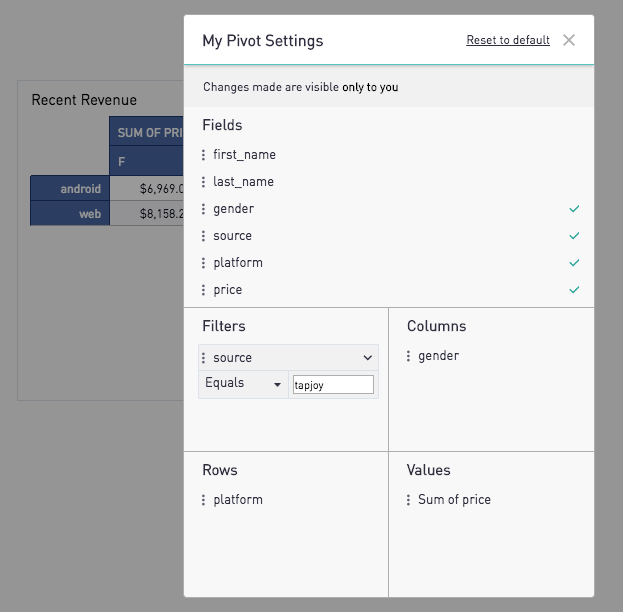
To assign a field as a row, drag it from the Fields list into the Rows box. To add columns, drag the field from Fields list to the Columns box.

<a href="#top">Back to top</a>
<a name="Values"></a>
Values
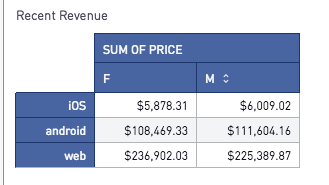
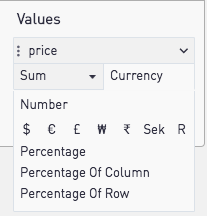
Data values can be added to a pivot table to show an aggregated value per column and row.
Fields used as values are aggregated for their respective row and column. Aggregation options include: Sum, Count, Average, Minimum and Maximum. To set the value's format, click the arrow next to the value to open its dropdown, and select a format option from the aggregation dropdown.
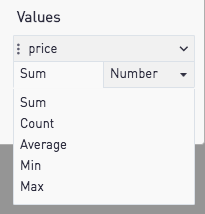
Aggregated values can be formatted within the pivot table. To set the value's format, click the arrow in the value to open its dropdown, and select an option from the format dropdown on the right side.
Note: Formatting applied in the Series Settings tab of the chart editor will apply to the pivot table values, while pivot table values formatting will supplant, but not alter, the underlying table's formatting.
<a href="#top">Back to top</a>
<a name="Filters"></a>
Filters for Pivots
Data within a result set can be filtered within the pivot table to limit the data being displayed. To filter on a field, drag it from the Fields list to the the Filters box.
String and date values can be filtered by selecting one of the following options from the dropdown and entering a string: Equals, Does not Equal, Contains, Begins With, and Ends With.
Numeric values can be filtered by selecting one of the following operators: >, <, ==, !=, >=, and <=.
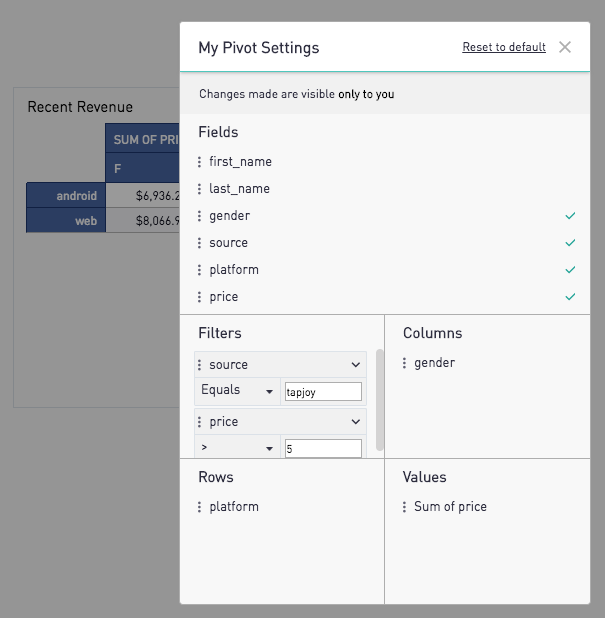
Fields selected as columns, rows, or values can be used as filters for pivot tables.
Note: Filters used in pivot tables are separate from dashboard filters and only filter the data within that table's result set.
<a href="#top">Back to top</a>
<a name="Modification"></a>
Modification and Formatting
<a href="#top">Back to top</a>
<a name="Fields"></a>
Available Fields for Pivoting
The fields and data available for the pivot table come from the SQL query generating the underlying table. Fields for the pivot table can be adjusted by modifying the columns in the SQL query.
Combining dashboard filters with pivot filters allows for even more customization in the data available to pivot.
<a href="#top">Back to top</a>
<a name="FormattingMod"></a>
Formatting Modification
Pivot table columns automatically carry over numeric formatting from the table's Series tab. Additional formatting for Values used in the pivot table can be adjusted in the Values section of the pivot. However, these settings will not be kept once the pivot table is restored to the non-pivoted version as the underlying table.
<a href="#top">Back to top</a>
<a name="Settings"></a>
Settings and Permissions
Customized pivot tables are similar to Sisense's custom filters, the pivot table settings are user-specific views of the data. This means that two users can pivot the same table chart with different settings, and not affect each other's work. However, as with filters, one pivot setting can be set as the default setting for the dashboard for all users. Under this circumstance, new users to the dashboard will see the default pivot setting of the table.
<a href="#top">Back to top</a>
<a name="Permissions"></a>
Pivot Creation and Editing Permissions
Pivot tables can be created and edited at the dashboard level by all users who have View access to the dashboard. Since one user's pivot settings don't affect another user's pivot settings, read-only users cannot affect each other's pivots.
<a href="#top">Back to top</a>
<a name="Default"></a>
Default Pivot Table Settings for Dashboard
Similar to filter defaults, pivot settings can also be set as the default view for all users on the dashboard. In order to set a user's pivot table settings as the default setting, the user must be a write-access user and have edit access to the dashboard. To set one pivot settings as the default for all users of the dashboard, click on the Edit Chart icon of the table to open the Chart Editor.

Inside the Chart Editor, click the "Edit Pivot" icon to bring up the Pivot Settings menu for the pivot table.
Within the right hand side of the table's Pivot Settings, turn the toggle from Private to Default, which will save changes made as the default pivot settings for all users.
Once saved, all users will see the default pivot table settings when visiting the dashboard unless they have a different user-specific pivot setting.
<a href="#top">Back to top</a>
<a name="ResettingDefault"></a>
Resetting to Default Settings

The Reset to Default link at the top right of the Pivot Settings menu will always reset pivot settings to the default pivot settings. The non-pivoted version of the table will act as the default only when no user has saved pivot settings as the Default Pivot Settings for all users on the dashboard.
However, if the chart has a pivoted table as the Default Pivot Settings, the Reset to Default link will only reset the pivot settings to the Default Pivot Settings. To change the pivot table to a non-pivoted version of the table, the user can either edit the pivot settings at the dashboard level by removing all fields from pivot, or the user can use the Edit Chart link at the top right of the table and remove all fields used for the pivot.
To make the non-pivoted version of the table the Default Pivot Settings of the table, a write-access user with edit access on the dashboard needs to click the Edit Chart icon at the top right of the chart. After removing all fields used for the pivot, the user can then turn the toggle from Private to Default and save this non-pivoted version as the default view for all users on the dashboard.
<a href="#top">Back to top</a>
<a name="Share"></a>
Sharing a Pivot Table
Pivot tables take on the default view that is configured from within the chart editor when shared with others using the dashboard link. The default view can appear as the non-pivoted version of the table or as a pivoted table depending on what is configure.
Similar to dashboard filters, once a user makes a change to a table, those settings are kept with that user until they are changed or reset to the default view.
Tables can be pivoted outside of Sisense within a shared or embedded dashboard. Pivot settings are maintained as long as the page is open and will reset to the default once the page is left or refreshed.
<a href="#top">Back to top</a>
<a name="NotesandTips"></a>
Notes and Tips
<a href="#top">Back to top</a>
<a name="TurnOff"></a>
Turning off Pivotability
Pivot tables cannot be turned off for a table. However, since pivot table settings are user-specific, one user's pivot settings will not affect those of another user.
<a href="#top">Back to top</a>
<a name="Drilldowns"></a>
Pivot Table and Drilldowns
Drilldowns are not supported on pivot tables.
<a href="#top">Back to top</a>
<a name="Shared"></a>
Pivot Tables in Shared & Embedded Dashboards
Shared and Embedded dashboards do not have user-designations. As such, pivot settings are reset as default settings when shared or embedded dashboard is refreshed.
<a href="#top">Back to top</a>
<a name="Timeout"></a>
Pivot Timeout
Pivots that take longer than 3 seconds to render will be automatically paused to prevent the browser from getting overloaded.
<a href="#top">Back to top</a>