GeoJSON
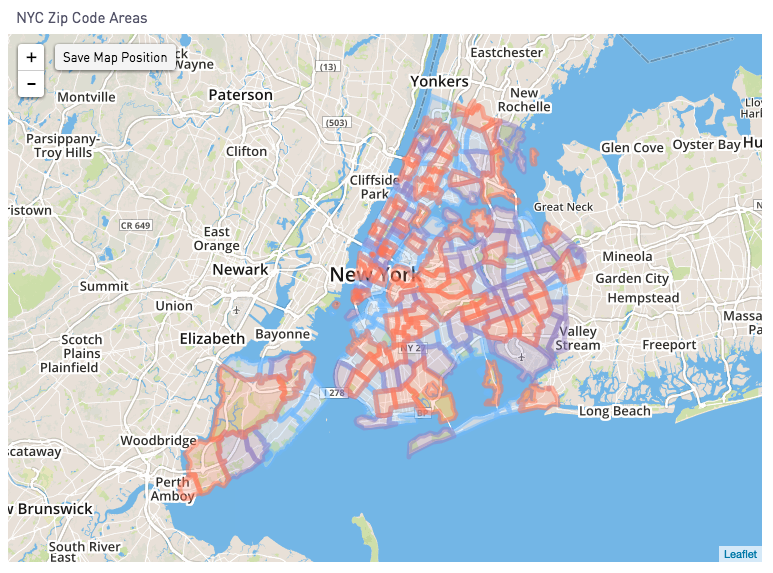
Plotting GeoJSON
To plot GeoJSON, select a single column of GeoJSON blobs, and select the "GeoJSON" checkbox from "Map Data Settings" in the "Series Settings" tab:
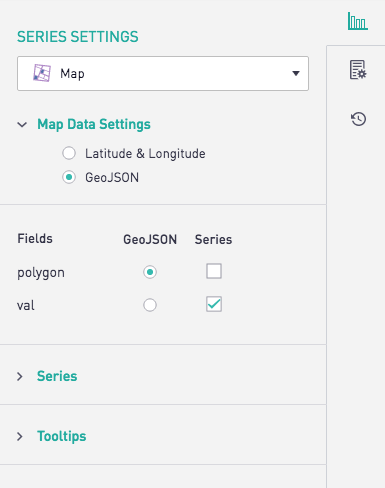
Sisense for Cloud Data Teams requires the value after the "Geometry" key, as seen in purple below, to be selected. Within the Geometry key, the types that are supported are: Polygon, Point, LineString and MultiPolygon.
{
"type": "Feature",
"geometry": {
"type": "Point",
"coordinates": [-122.3894, 37.7519]
},
"properties": {
"name": "Periscope Data's Intergalactic Headquarters"
}
}
Segmenting GeoJSON
Additional columns can be selected to specify colors for distinct GeoJSON areas. Once a valid column has been added, it can be checked as the Segmentation value in the Series tab.

The resulting chart applies the specified color to each GeoJSON Area.