Workbooks (also known as Dashboards) and Chart Refresh Mechanics
👤 This documentation is intended for View, Discovery, and SQL Users. Site Administrators seeking higher level of control over Dashboard Refresh Mechanics should refer to the documentation on the Dashboard Refresh Management feature.
Dashboard Refresh Rates
Sisense for Cloud Data Teams automatically schedules a dashboard to be refreshed regularly in the background based on the total number of dashboards across the site. At the moment of refresh, all charts on a dashboard are passed into the refresh queue at the same time.
Background Refreshes
Dashboards will be queued for refresh based on how many dashboards there are across the site. The higher the total amount of dashboards, the less frequently each individual dashboard will refresh per day.
Sisense will refresh the dashboard with the default filter set along with any unique filter sets applied by other users or used in shared dashboards. If a filter set goes more than 7 days without being viewed for at least 10 minutes, it is deemed inactive and will no longer be scheduled for refresh.
Manual refreshes can be launched for all of the charts on a dashboard by selecting the refresh button in the dashboard header. This should look similar to the following image:

The last time a dashboard was refreshed, as well as the total query runtime for the dashboard, can be viewed by hovering over the infomational 'i' icon. This is shown in the Dashboard Overview Documentation Page
Users can also configure custom refresh intervals by enabling the Dashboard Refresh Management add-on here. To enable this feature, site administrators can reach out to their Customer Success Manager.
Chart Refresh Rates
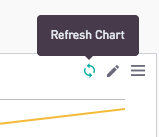
Charts do not have their own individual refresh rates. They are automatically refreshed when their dashboards get scheduled to refresh. Individual charts can be manually refreshed by selecting the "Refresh Chart" icon that appears when hovering over a saved chart. It should look similar to the image shown below.

Shared and Embedded Dashboards
Shared and Embedded Dashboards refresh with the same logic described above. Each Shared or Embedded dashboard is considered its own separate dashboard if it uses filters that are set to different values. It will automatically refresh depending on how often its in-app dashboard is refreshed.
Manually Refresh the Data
Shared and Embedded Dashboards can be manually refreshed by navigating to the original dashboard on Sisense. Once there, the user would want to apply the exact same filter values used to generate the Shared or Embedded dashboards. Then, the user would click the refresh button described earlier on this page. After refreshing the dashboard, navigating back to the Shared or Embedded Dashboard should reflect this update.
Controlling Refresh Rate in Embedded Dashboards
The Sisense Embed API includes a parameter called "data_ts" that is used to determine whether or not to refresh the dashboard. Setting this parameter does not guarantee that the dashboard is refreshed constantly. The parameter requires a unix timestamp, and does not work for future values. The best recommended practice for quick refreshes is to set the data_ts parameter to be a few minutes back from the present time.
Public CSV URL
Refresh rates for Public CSV URL data follow the same rates as the underlying dashboard with the specific filter set for a specific user. The specific filter set is determined by the user who generated the URL at the time of generation.
Emailed Dashboards
Dashboards can be scheduled to email once a day or once a week. To set that up, follow the instructions here.
Emailed Dashboards are scheduled to refresh with the default filter set. Charts on the dashboard are refreshed at the specified time, and the email is sent upon completion of the refresh.
Manually Refreshing Data for Emailed Dashboards
As described earlier in the Shared and Emailed Dashboards section, a refresh can be manually enforced by applying the default filters and refreshing all the charts.
