
Query Management
The Query Management feature allows visualizing and managing query queues for the site.
Note: Query Management is an add-on feature. Please contact your Account Manager for additional information.
Overview
To open the Query Management menu, Admins can first click the Settings menu at the bottom of the left hand navigation bar. Then, click on Query Management.

The query management screen displays the list of all user-initiated queries that are either running or pending for that space. This includes queries initiated through a manual refresh of a chart or dashboard, filter changes, or queries ran from the SQL editors for charts, Views, or SQL Alerts. The dropdown menu at the top can be used to specify for which database to view the list.
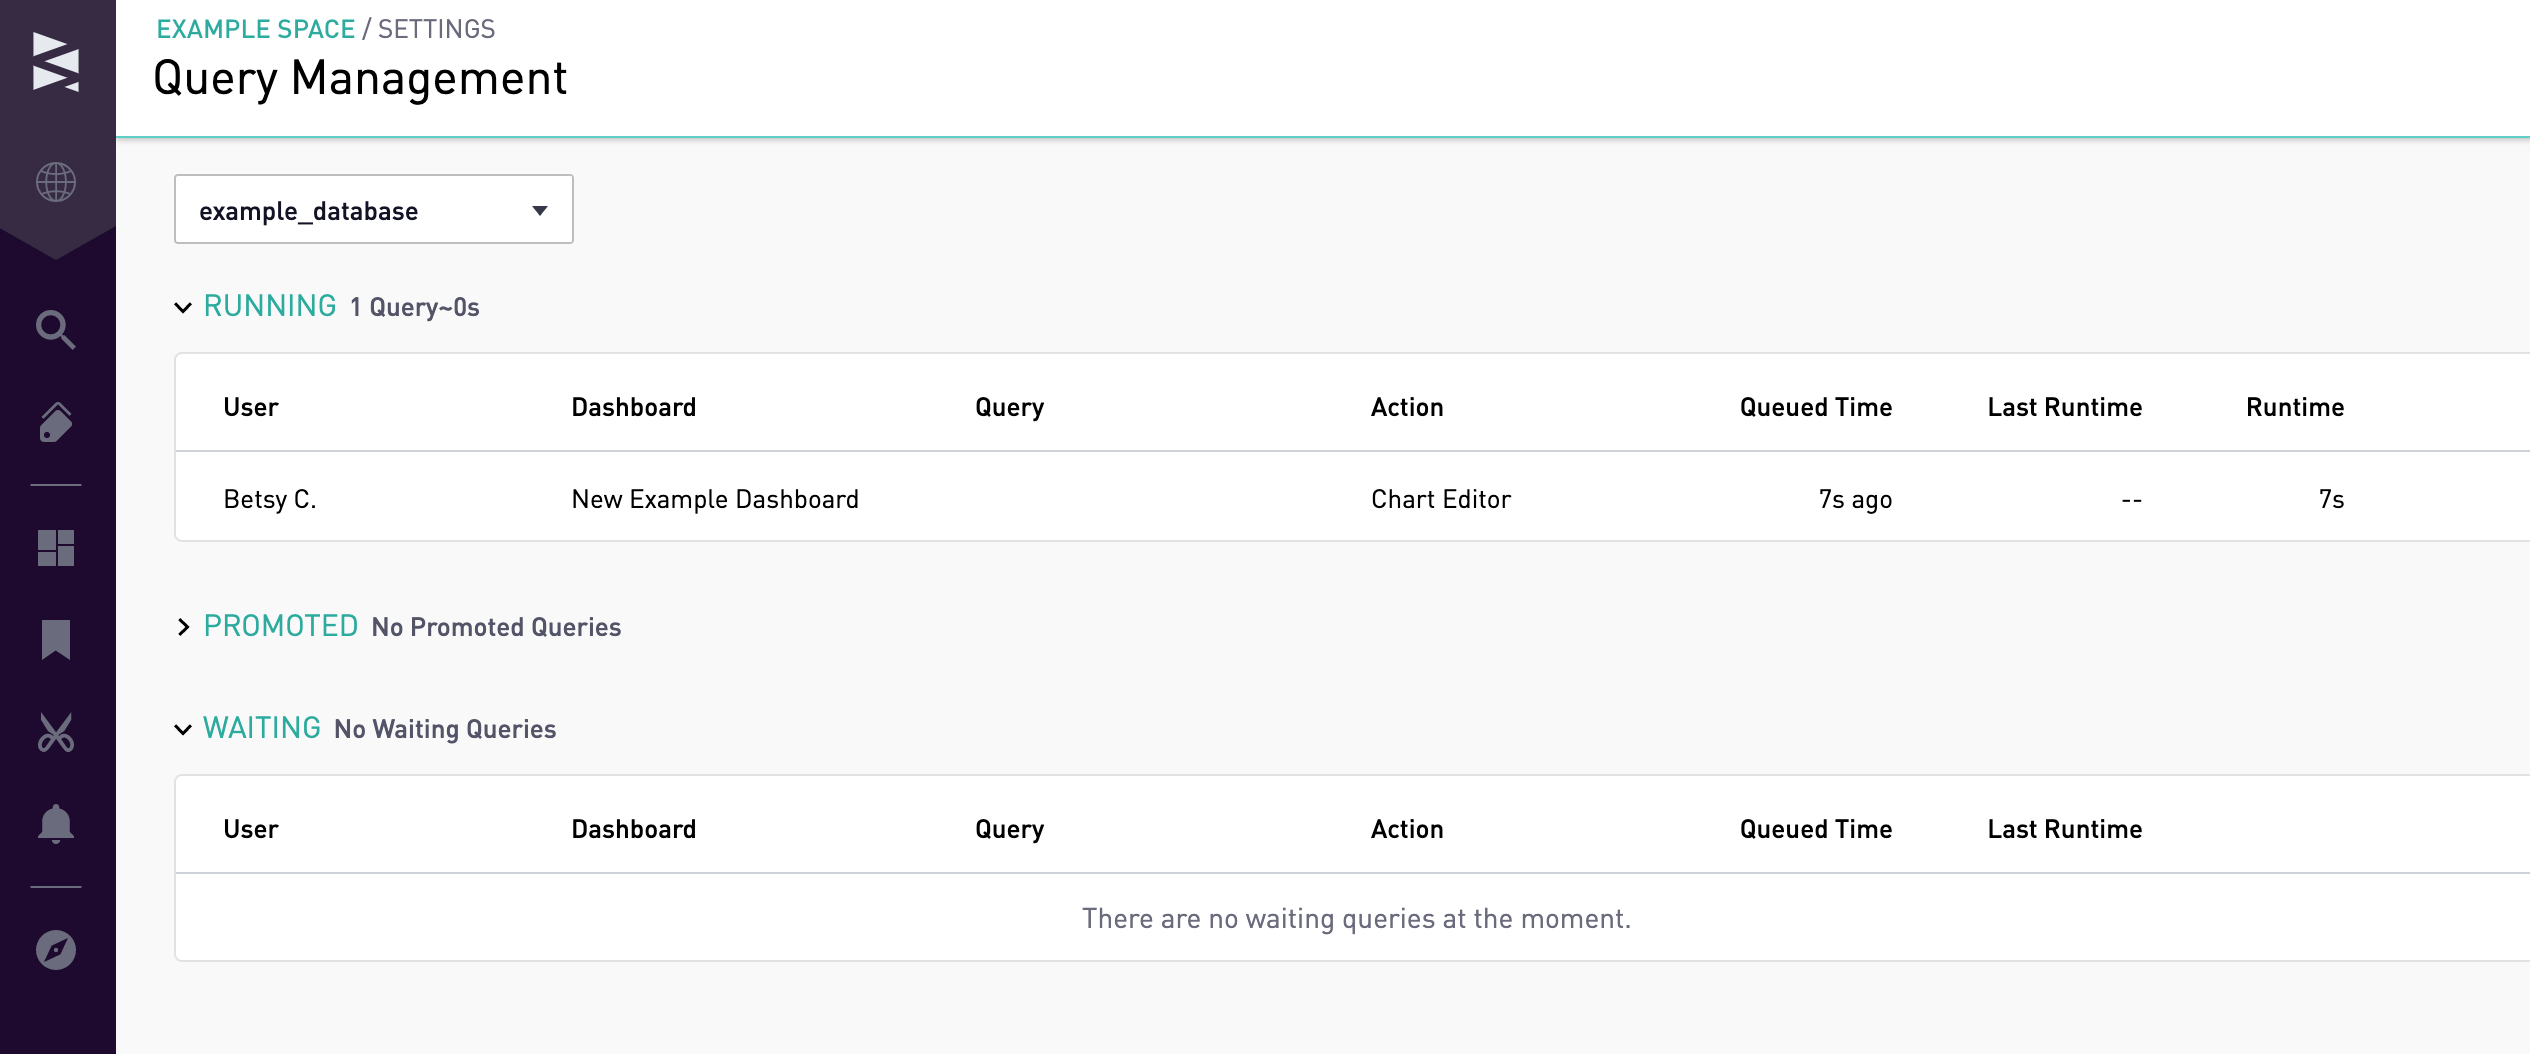
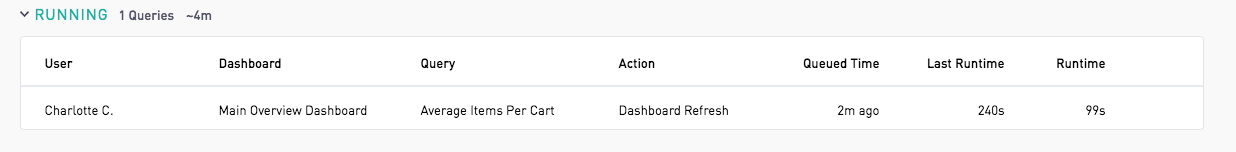
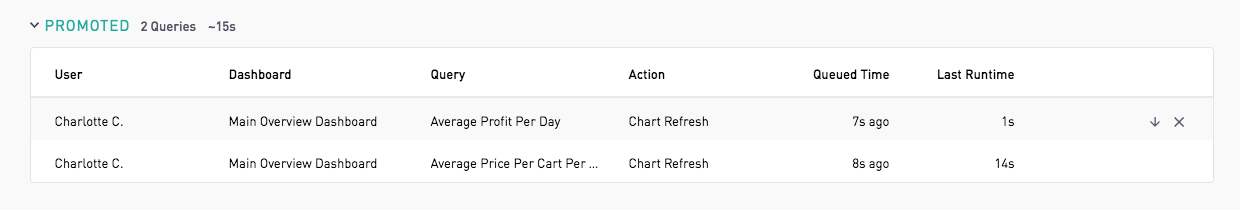
In the Running and Promoted sections, queries are listed individually in the order they were queued.
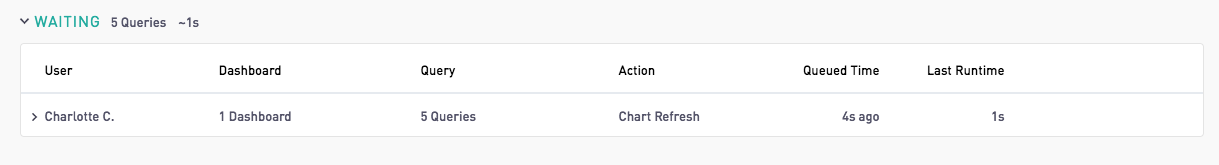
In the Waiting section, queries are listed per user, listed from most to least queries initiated.
Promoting and Cancelling Queries
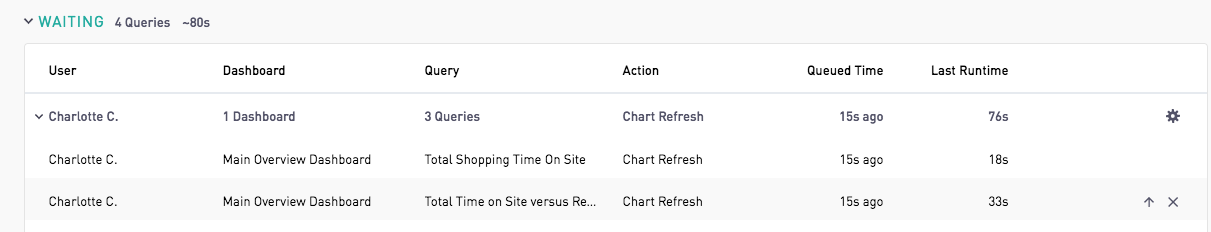
Queries in the Waiting section can be promoted to the Promoted section or cancelled in bulk by user by clicking on the gear icon to the left and choosing "Promote All" or "Cancel All".

Individual queries in the Waiting section can be bumped to the Promoted section or cancelled by drilling down on the user and clicking on the up arrow or 'X' icons, respectfully.
Individual queries in the Promoted section can be demoted back to the Waiting Section or cancelled by clicking the down arrow or 'X' icons, respectfully.
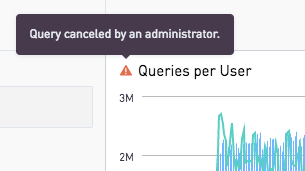
Queries that have been cancelled from the Query Management Page will show results from the last time the chart was run with an error icon indicating that the query was cancelled by an Administrator.
Action Type Definitions
Chart Refresh: The user manually refreshed a chart
Dashboard Refresh: The user manually refreshed an entire dashboard
Chart Editor / View Editor / SQL Alert Editor: The user ran a query within the editor
Pageload: The user loaded a dashboard with a chart that didn't have data yet
Filter Change: The user changed a filter
Shared Dashboard Chart Sync: The user edited a chart that is also on shared dashboards, and a chart update was scheduled for each share
Chart Definition Sync: The user updated the sql for a chart with filters. The user did not have the default filters selected, so a chart update for default filters was scheduled
Chart Auto Update: The chart definition changed in the background, either through a snippet change or some other user changing a chart
Scheduled Dashboard Refresh: The Render API was called for a dashboard and the system triggered a refresh to ensure the render contains up to date data
Background Dashboard Email: An email report of the dashboard was sent and the system triggered a dashboard refresh to ensure the render contains up to date data
Refresh API: The Refresh API for an embedded dashboard was used to refresh the charts contained in the embed
CSV Download: The user manually requested a CSV Download of chart data